How to Increase NOI at Office Buildings
Office OpEx has outgrown revenue every year since 2021. Here's the one line item that's still yours to fix.

Key takeaways
- Office operating expenses have grown 2.7% a year since 2021 vs. 1.3% revenue growth — NOI growth has averaged just 0.2%, per Trepp, as published this week in the CRE Daily newsletter.
- Insurance (+6.1%/yr) and utilities (+4.9%/yr) are the biggest drivers — and neither is something an owner controls.
- Parking is a rare exception: its cost structure is set by a contract, not a market, which makes it one of the only expense lines an owner can actually renegotiate.
- Four recent engagements posted NOI gains during this same squeeze — including two with disclosed run-rate gains totaling more than $790,000 combined — without adding a single parking space.
Trepp's analysis of CMBS-backed office properties, surfaced last week by CRE Daily, confirms what most office owners already feel in their monthly close: the math isn't working. Since 2021, operating expenses have grown at a 2.7% annualized clip, while revenue has managed just 1.3%. Net operating income growth across the same period: 0.2%. Median NOI was actually negative in 2021, 2024, and 2025.
The drivers won't surprise anyone who's opened a P&L lately. Insurance is up 6.1% a year. Utilities, 4.9%. Payroll and benefits, 3.3%. Repairs and maintenance, 3.2%. Even real estate taxes, typically the slowest-moving line, are climbing at 1.1%. Trepp's conclusion is blunt: expenses outgrew revenue in every one of the seven Census divisions it studied, and shrinking cash flow is now the binding constraint on refinancing, regardless of where rates go.
Most of that expense growth is not something an owner controls. You don't set insurance markets, or utility rates, or property tax assessments. Those lines move with the macro environment, and the best an owner can usually do is shop it, appeal it, or absorb it.
But there's one line on that same P&L that behaves completely differently because, unlike insurance or utilities, its cost structure isn't set by a market. A signed contract sets it: parking.
The expense line that's actually a lever
Parking rarely gets much attention on an office operating statement, which is exactly the problem. On a Class A urban office asset, parking typically represents 8–15% of total NOI; on a suburban office park, it's usually 5–10%. For a property carrying tens of millions in valuation, that's not a rounding error — at a 5.5% cap rate, an incremental $100,000 in parking NOI is worth roughly $1.8 million in asset value.
Most of that value is currently leaking, and it's leaking for a structural reason we call the operator margin tax. Traditional parking operators are typically compensated on a percentage of costs, revenue, or both. That means every additional staffer, every markup on insurance, every fragmented vendor contract for access control, payments, and reporting adds to what the operator bills you back — and there's no structural incentive on their side to run leaner or automate. In an environment where every other expense line is already climbing on its own, paying a margin on top of an inflated cost base is the one piece of the puzzle an owner can actually renegotiate.
Curious what that gap looks like on your own property? Run your numbers through Vend's savings calculator →
What it looks like when someone actually fixes it
This isn't theoretical. Over the past two years, owners who have moved their parking operations onto an integrated, owner-first model — rather than a traditional margin-share operator — have posted NOI gains in the same climate Trepp is describing as a five-year squeeze:
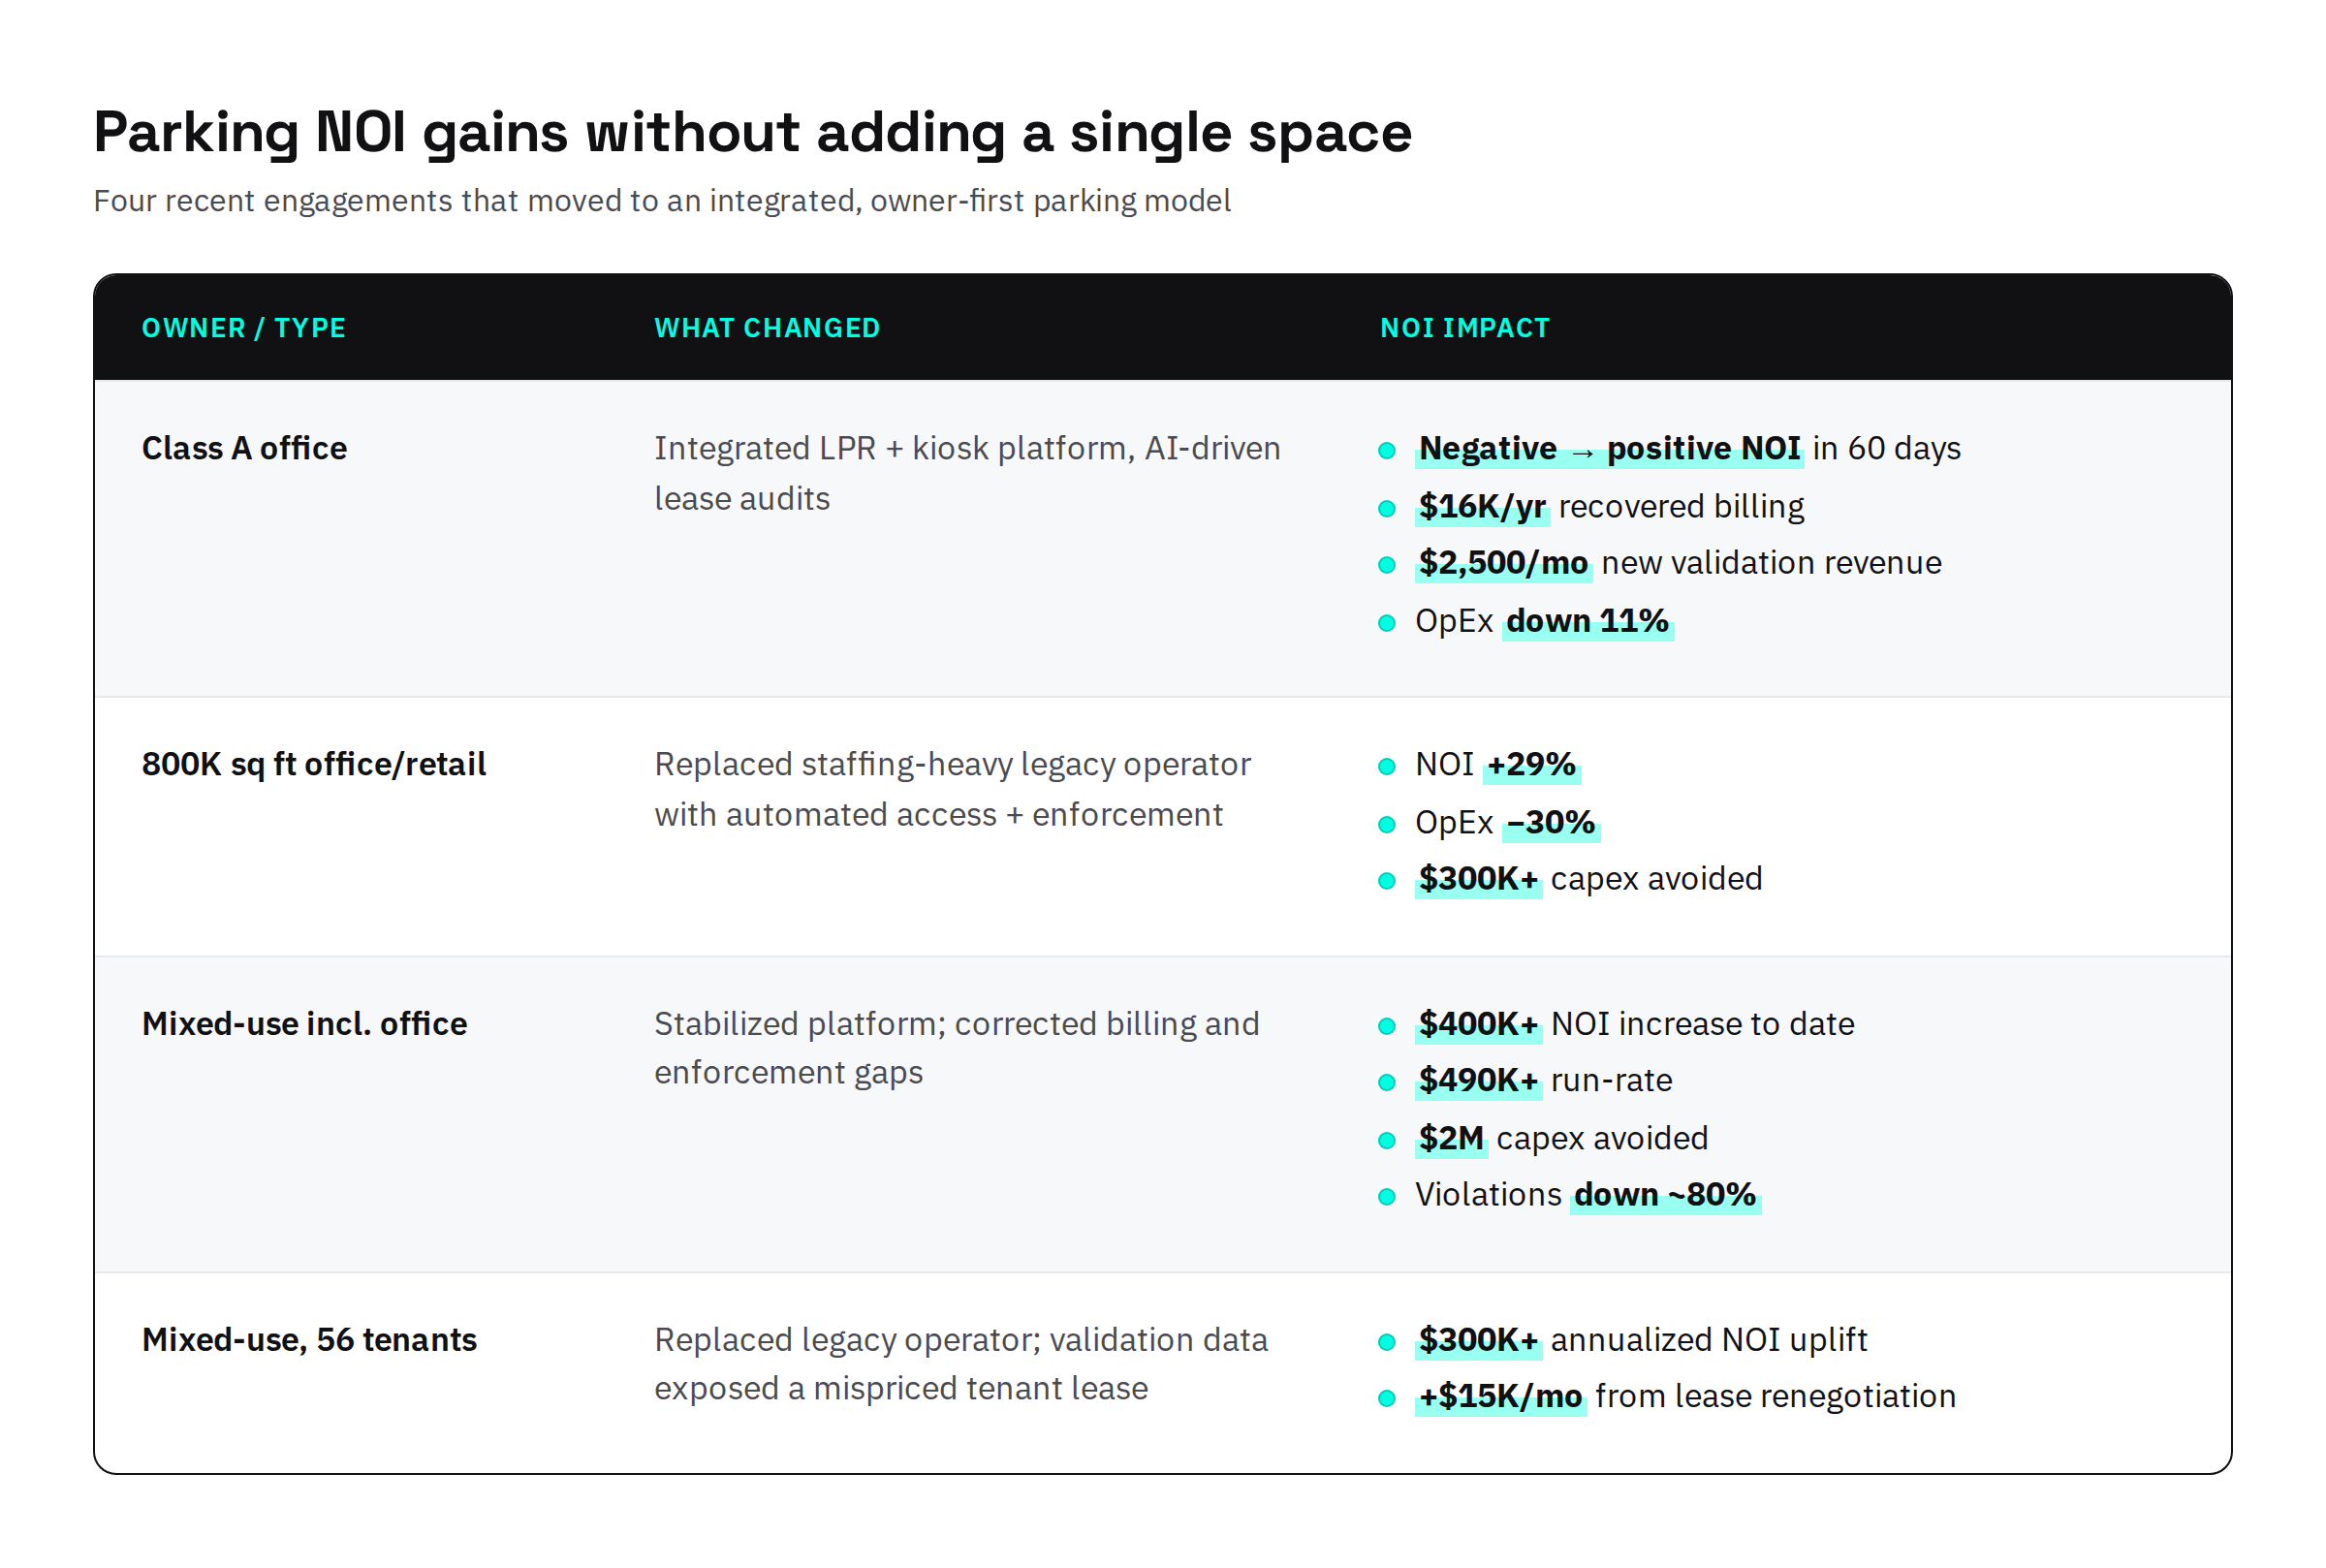
None of these gains came from new construction, added spaces, or rate shock to tenants and visitors. They came from correcting the same things that quietly erode NOI at almost every property: unbilled monthly parkers, unenforced validation programs, unreliable equipment with no visibility, and a cost structure that rewarded the operator for growing, not shrinking, the expense line.
Why this matters right now
Trepp's data shows an office sector where the controllable levers — staffing, capex, discretionary spend — are already being pulled hard, and the uncontrollable ones — insurance, utilities, taxes — keep climbing regardless. Parking sits in a rare third category: an expense line where the market isn't setting the price, a contract is, and where the revenue side (transient parking, validations, event and overflow demand) is still growing as leasing activity picks up in high-quality buildings. It's one of the few places left on an office operating statement where an owner can move the trend line in the right direction without waiting for the rate environment to cooperate.
If you haven't looked closely at your parking contract recently, three questions are worth asking before your next budget cycle:
- What percentage of your parking expense is payroll, and who profits from it?
- How many separate vendors are stitched together to run access, payments, validations, and reporting?
- And can you see today's parking revenue, or only last month's, after your operator has already reconciled it their way?
.png)
.webp)
